Comparing Group Means
Independent Groups t-test
When do you use it?
If you have 2 independent groups of subjects and you wish to compare
the two groups.
The independent t-test is based on the assumption that the variances of
the two groups are not difference (equality of variance or homogeneity of variance).
Two tests used most often (use the F statistic):
1.
Levene’s test
2.
Bartlett’s test
The difference between group means indicates the degree of separation BETWEEN groups (the effect size).
Variance measures tell us how variable the scores are WITHIN each group.
Sample Data
Question: What
are the differences between grip strength between two groups? We are only testing
one time.
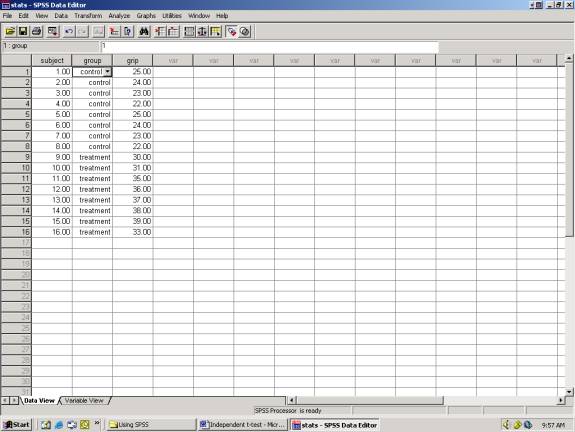
Group 1: Carpal
Tunnel Syndrome patients with no treatment (control)
Group 2: Carpal Tunnel Syndrome patients with
treatment (treatment)
In this scenario, if there is a
difference BETWEEN THE GROUPS, but no variance WITHIN THE GROUPS,
then all differences can be EXPLAINED by the effect of the treatment.
However, if we cannot EXPLAIN
the differences between the groups (due to variance within the group), then
this is known as ERROR VARIANCE.
This error may be due to:
1. personal characteristics
2. inconsistencies in measurement
3. unknown behavioral and environmental factors.
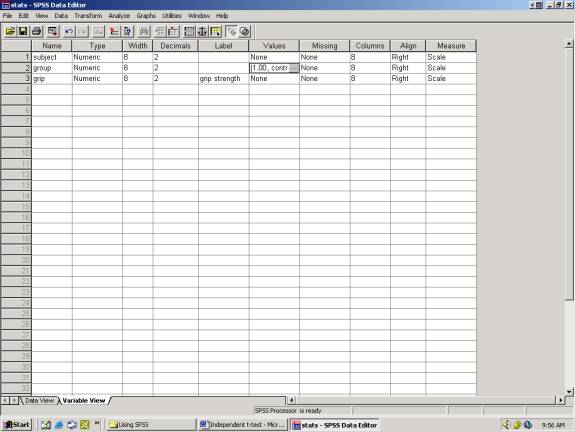
Variable View:
Data View:
To run statistics select:
Analyze
Compare Means
Independent-Samples T-Test
The Independent-Samples T Test window (see Figure below) that appears will list all your variable to the left of the screen along with two boxes labeled Test Variable(s): and Grouping Variable:. The dependent variable to be analyzed will be put in the Test Variable(s): box and the variable defining the two groups will be placed in the Grouping Variable box.
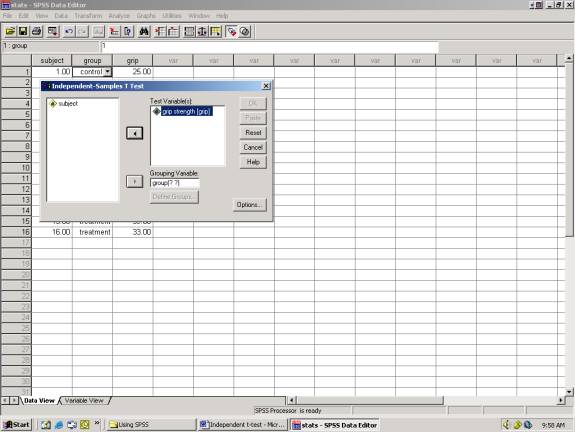
The grouping variable in this case will be the two groups
(control and treatment). You will
notice in the above figure that group has two question marks. You will need to click on Define
Groups.
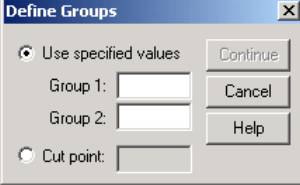
Group 1: 1
Group 2: 2
Although this seems kind of redundant to enter this, just remember, you may have more than 2 groups. If you have 3 groups, then you may compare 2 vs. 3.
After entering the group information, click Continue and OK.
Your statistics will run and a data sheet will be produced that looks like this.
5 4 3 2 1![]()
![]()
![]()
![]()
![]()
![]()
![]()
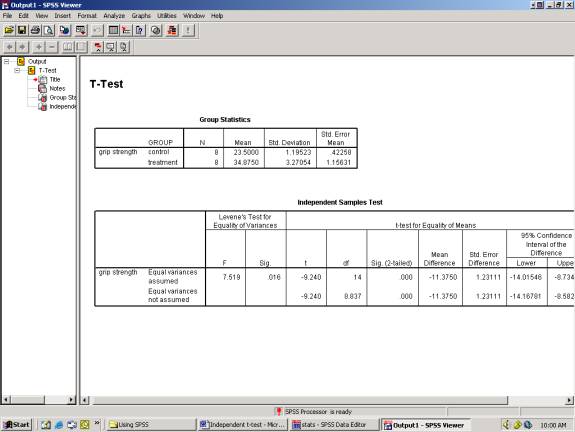
Reading Your Output:
- Mean, Std. Deviation, and Std. Error of Mean.
- Levene’s test is significant (p=.016). Therefore, we will use the t-test for unequal variances.
- Equal variances assumes and equal variances not assumed. If your sample size is even (8 subjects in group 1 and 8 subjects in group 2) then analyze the first line only. If you have a significant test (#2), but you have unequal groups (8 subjects in group 1 and 15 subjects in group 2), use the t-test for unequal variances. The degrees of freedom will be different.
- The two-tailed significance for the t-test is .000. This analysis was based on a two-tailed test. The one-tailed significance level is ½ of the two-tailed value. This is significant and we reject Ho.
- The 95% confidence interval does not contain zero. Therefore, the difference between means is significant.