Comparing Group Means
Dependent (Paired) t-test
When do you use it?
If you have 1 group that you are testing 2 times (pre-test vs. post
test). Used to determine if a treatment
worked.
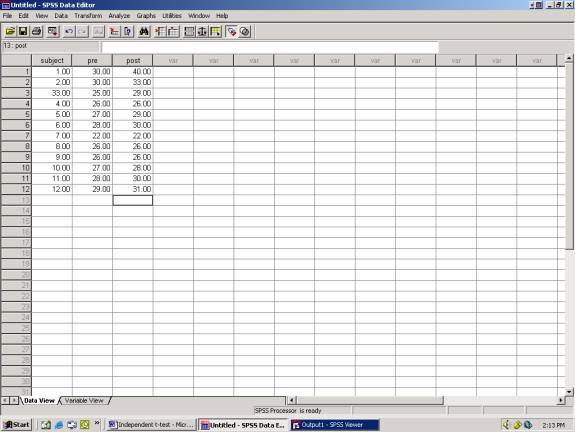
Sample Data
Question: What are
the differences in grip strength between the pre-test and posttest? We are testing each
individual TWO times.
Pretest: Carpal
Tunnel Syndrome patients with no treatment (control)
Posttest: Carpal Tunnel Syndrome patients with
treatment (treatment)
In this scenario, if there is a
difference BETWEEN THE PRETEST and POSTTEST, but no variance WITHIN
THE GROUPS, then all differences can be EXPLAINED by the effect of
the treatment.
Variable View:
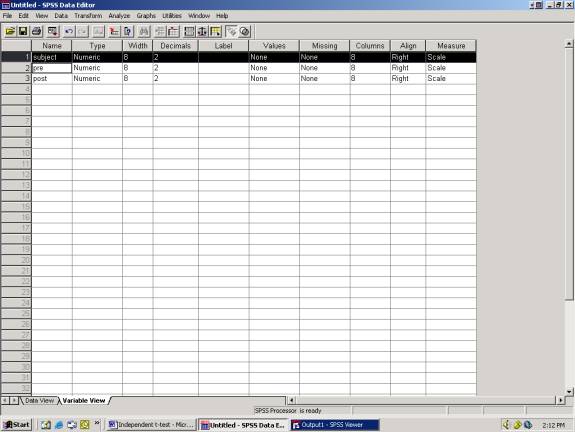
The variables in this example are
1)
subject number
2)
pre test values
3)
post test values
Data View:
Click on Data View

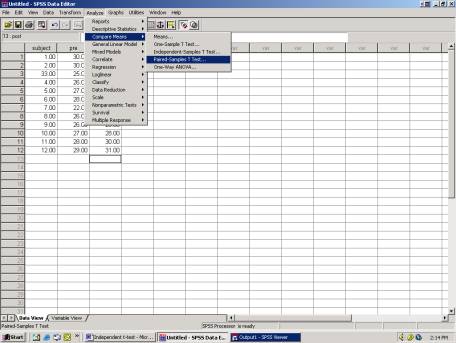
To run paired t-test statistics select:
Analyze
Compare Means
Paired Samples T-Test
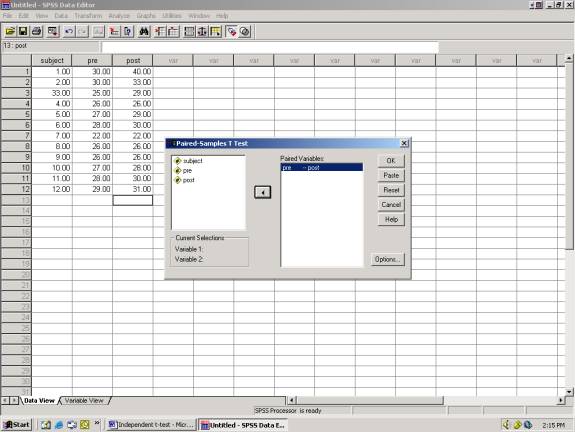
2) Click
“post” second and it will appear in Variable 2 3) Click
“ok” 1) Click “pre”
first and it will appear in Variable 1
![]()


After clicking “ok” your statistics will appear.
Mean, number of subjects in each group (N), standard
deviation and standard error of mean 5 4 3 2 1
![]()
![]()
![]()
![]()
![]()
![]()
![]()
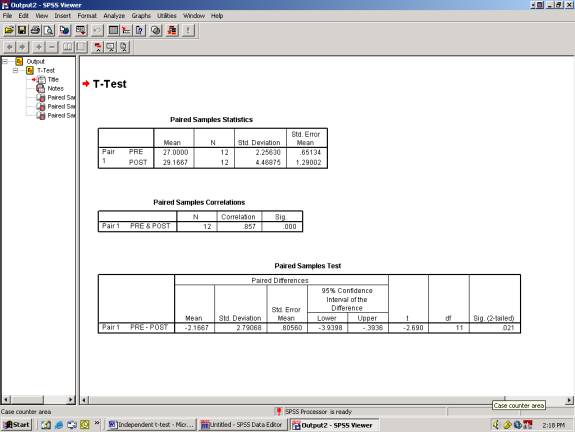
What your statistics mean
1) Is there a correlation between our pre and post test that is significant? In this example, “yes”. Perfect correlations are “1.0” and in our case it is .857 .
a. Normally, correlations ranging from:
0.00- 0.25 indicate little or no relationship
0.25-0.50 a fair degree of relationship
0.50-0.75 are moderate to good
> .75 are good to excellent
2) Mean of the difference scores
3) Standard deviation and standard error mean of the different scores
4) Confidence Intervals. The computer automatically selects a 95% CI. The scores does not contain zero, indicating a significant difference.
5) Two tailed significance. It is less than 0.05 so there is a significant difference in pre and post test scores. This indicates that the treatment works. (If we wanted a one-tailed significance score, then divide by 2.)